Probability & Statistics
Probability
Set Theory
- A set is a collection of elements
- Elements are members of a set
- means "the element is a member of the set
- The empty set contains no elements
- It is empty
-
- is a set consisting of those integers
-
-
-
- is a subset of
- implies
- for all sets
- if and only if and
- is the union of and
- Set of elements belonging to or
- is the intersection of and
- Set of elements belonging to and
- Disjoint sets have no common elements
- is the different of and
- Set of elements belonging to but not
- is the complement of
- Set of elements not belonging to
Random Processes & Probability
The probability of event occurring is denoted . This is the relative frequency of event occurring in a random process within sample space S.
-
- Certain or sure event, guaranteed 100% to happen
-
- Impossible event, won't happen
-
- Elementary event, the only event that can happen, the only possible outcome
-
- Event that occurs if or occurs
-
- Event that occurs if and occur
-
- Event that occurs if does not occur
-
- Events and are mutually exclusive
Example
Toss a coin 3 times and observe the sequence of heads and tails.
- Sample space
- Event that heads occur in succession
- Event that 3 heads or 3 tails occur
Another Example
Sample space . Each number is an individual event.
| Events | Frequency | Relative Frequency |
|---|---|---|
| 17 | 3 | 3/35 |
| 18 | 4 | 4/35 |
| 19 | 9 | 9/35 |
| 20 | 11 | 11/35 |
| 21 | 6 | 6/35 |
| 22 | 2 | 2/35 |
Axioms & Laws of Probability
- for all
- Probabilities are always between 0 and 1 inclusive
-
- Probability of the certain event is 1
- If then
- If two events are disjoint, then the probability of either occurring is equal to the sum of their two probabilities
-
- The probability of the impossible event is zero
-
- The probability of all the elements not in A occurring is the opposite of the probability of all the elements in A occurring
- If , then
- The probability of A will always be less than or equal to the probability of B when A is a subset of B
-
- The probability of A minus B is equal to the probability of A minus the probability of A and B
-
- Probability of A or B is equal to probability of A plus the probability of B minus the probability of A and B
- This is important
Example
In a batch of 50 ball bearings:
- 15 have surface damage ()
- 12 have dents ()
- 6 both have defects ()
The probability a single ball bearing has surface damage or dents:
The probability a single ball bearing has surface damage but no dents:
Conditional Probability & Bayes' Theorem
A conditional probability is the probability of event occurring, given that the event has occurred.
Bayes' theorem:
Axioms of conditional probability:
Example
In a semiconductor manufacturing process:
- is the event that chips are contaminated
- is the event that the product containing the chip fails
- and
Determining the rate of failure:
Independent Events
Two events are independent when the probability of one occurring does not dependend on the occurrence of the other. An event is independent if and only if
Example
Using the coin flip example again with a sample space and 3 events
A and C are independent events:
B and C are not independent events:
Discrete Random Variables
For a random process with a discrete sample space , a discrete random variable is a function that assigns a real number to each outcome .
- is a measure related to the random distribution.
- Denoted
Consider a weighted coin where and . Tossing the coin twice gives a sample space , which makes the number of heads a random variable . Since successive coin tosses are independent events:
Events are also mutually exclusive, so:
This gives a probability distribution function of:
Cumulative Distribution Functions
The cumulative probability function gives a "running probability"
- if then
Using coin example again:
Expectation & Variance
- Expectation is the average value, ie the value most likely to come up
- The mean of
- Variance is a measure of the spread of the data
- Standard deviation
Using the weighted coin example once more:
Standardised Random Variable
The standardised random variable is a normalised version of the discrete random variable, obtained by the following transformation:
Binomial Distribution
- The binomial distribution models random processes consisting of repeated independent events
- Each event has only 2 outcomes, success or failure
The probability of successes in events:
- Probability of no success
- Probability of successes is
Expectation & Variance
Example
A fair coin is tossed 6 times.
Probability of exactly 2 heads out of 6
Probability of heads
Probability of heads
Expected value
Variance
Poisson Distribution
Models a random process consisting of repeated occurrence of a single event within a fixed interval. The probability of occurrences is given by
The poisson distribution can be used to approximate the binomial distribution with . This is only valid for large and small
Expectation & Variance
Example
The occurrence of typos on a page is modelled by a poisson distribution with .
The probability of 2 errors:
Continuous Random Variables
Continuous random variables map events from a sample space to an interval. Probabilities are written , where is the random variable. is defined with a continuous function, the probability density function.
- The function must be positive
- The total area under the curve of the function must be 1
Example
Require that , so have to find :
Calculating some probabilities:
Cumulative Distribution Function
The cumulative distribution function up to the point is given as
- if , then
-
- Derivative of cumulative distribution function is the probability distribution function
Using previous example, let . For
For
For
Expectation & Variance
Where is a continuous random variable:
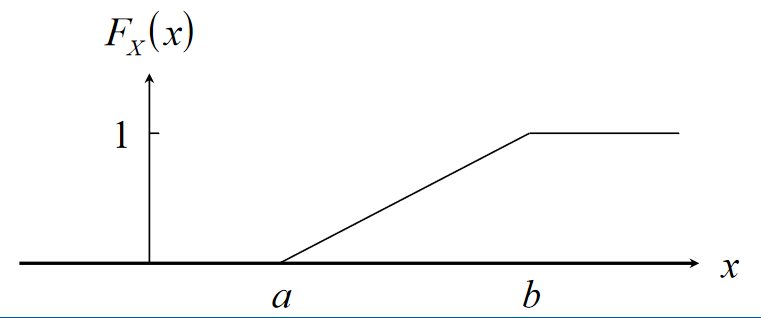
Uniform Distribution
A continuous distribution with p.d.f:
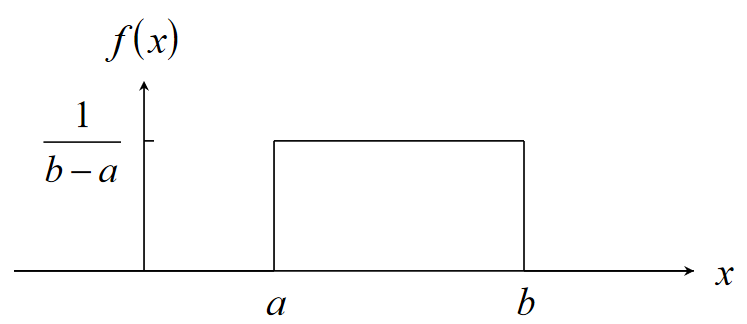
Expectation and variance:
Cumulative distribution function:
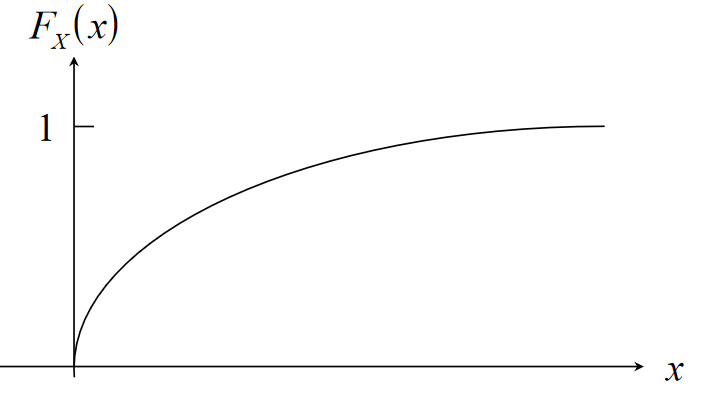
Exponential Distribution
A continuous distribution with p.d.f:
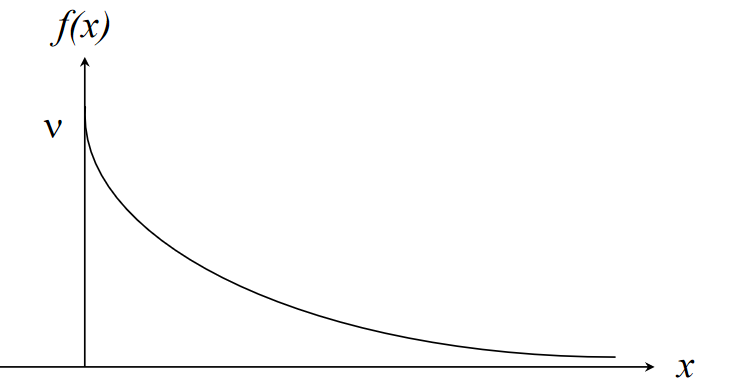
Expectation and variance:
Cumulative distribution function:
- Recall that a discrete random process where a single event occurs times in a fixed interval is modelled by a Possion distribution
- Consider a situation where the event occurs at a constant mean rate per unit time
- Let , then and probability of events occurring is
- Suppose the continuous random variable is the time between occurrences of successive events
- If there is a period of time with no events, then and
- If events occur then and
If the number of events per interval of time is Possion distributed, then the length of time between events is exponentially distributed
Example
Calls arrive randomly at the telephone exchange at a mean rate of 2 calls per minute. The number of calls per minute is a d.r.v. which can be modelled by a Poisson distribution with . The probability of 1 call in any given minute is:
The time between consecutive calls is a c.r.v. modelled by an exponential distribution with . The probability of at least 1 () minute between calls is:
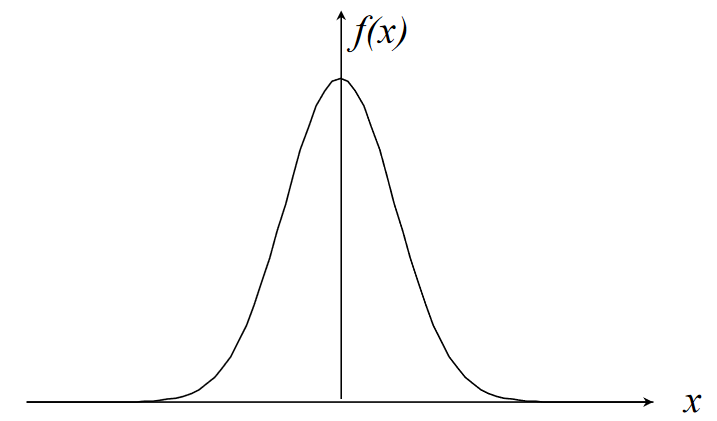
Normal Distribution
A distribution with probability density function:
Expectation and variance . Normal distribution is denoted and is defined by its mean and variance.
Standardised Normal Distribution
is a random variable with distribution . The standardised random variable is distributed and can be obtained with the transform: and has p.d.f.
where . Values for the standard normal distribution are tabulated in the data book.
Example
The length of bolts from a production process are distributed normally with and .
The probability the length of a bolt is between 2.6 and 2.7 cm (values obtained from table lookups):
Confidence Intervals
A confidence interval is the interval in which we would expect to find an estimate of a parameter, at a specified probability level. For example, the interval covering 95% of the population of is .
For a random variable with distribution , the standard variate . For confidence interval at 95% probability:
Using table lookups, , and:
For confidence interval at 99.9% probability:
Table lookups again, , and:
Normal Approximation to Binomial Distribution
The normal distribution gives a close approximation to the binomial distribution, provided:
- is large
- neither nor are close to zero
- and
For example, take a random process consitsting of 64 spins of a fair coin and . The probability of 40 heads is:
For a normal approximation, must use the interval around 40 (normal is continuous, binomial is discrete) :
Normal Approximation to Poisson Distribution
The normal distribution gives a close approximation to the binomial distribution, provided:
- is large
For example, say a radioactive decay emits a mean of 69 particles per seconds. A standard normal approximation to this is:
The probability of emitting particles in a second is therefore: