Second Order Frequency Response
How second order systems respond to sinusoidal/oscillating input. Similar to first order.
Gain and Phase for Second Order Systems
For a 2nd order system in standard input-output form:
The gain and phase of the frequency response are therefore:
Bode Plots, from Data Book
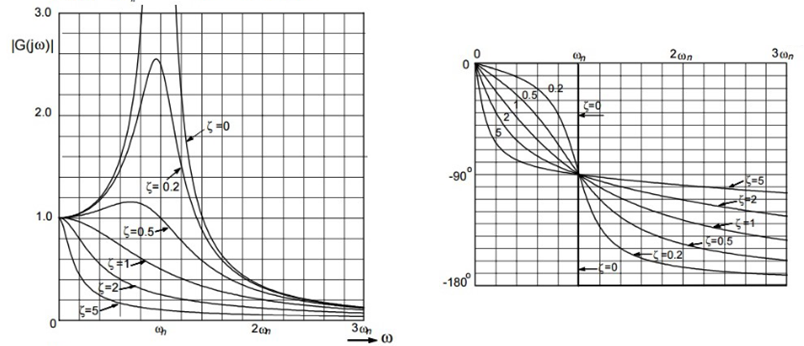
The plots show gain and phase shift for varying values of
Example
For the electrical system shown below with the values , , find:
- The undamped natural frequency
- The damping factor
- Sketch the magnitude of the frequency response
- At what frequency is this at it's maximum?
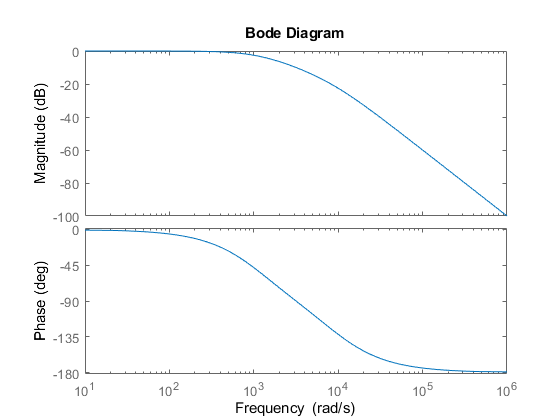
- Sketch a bode plot using matlab
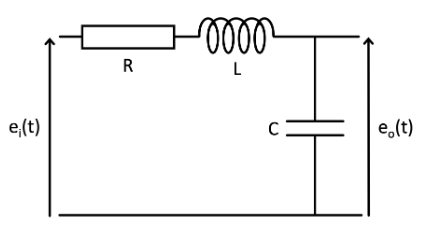
The system equation is:
Undamped natural frequency:
Damping factor:
Using the graph from the data book
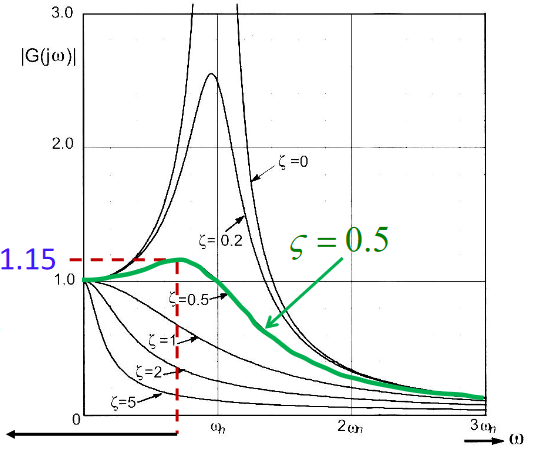
The graph peaks at approx , so:
Matlab plot:
R = 1000
C = 10e-7
L = 0.1
sys = tf([1],[L*C R*C 1]); figure; step(sys);
bode(sys);