First Order Frequency Response
Frequency response is is the response of a system to a sinusoidal/oscillating input.
Response to Sinusoidal input
For a standard first order system , with a sinusoidal input :
The sinusoidal part of the equation is the steady-state that the response tends to, and the exponential part is the transient part that represents the rate of decay of the offset of the oscillation.
- The frequency of input and output is always the same
- It is the amplitude and phase shift that change
- These depend on the input frequency
- This dependence is the frequency response
Example
The example below shows an input , and its output with
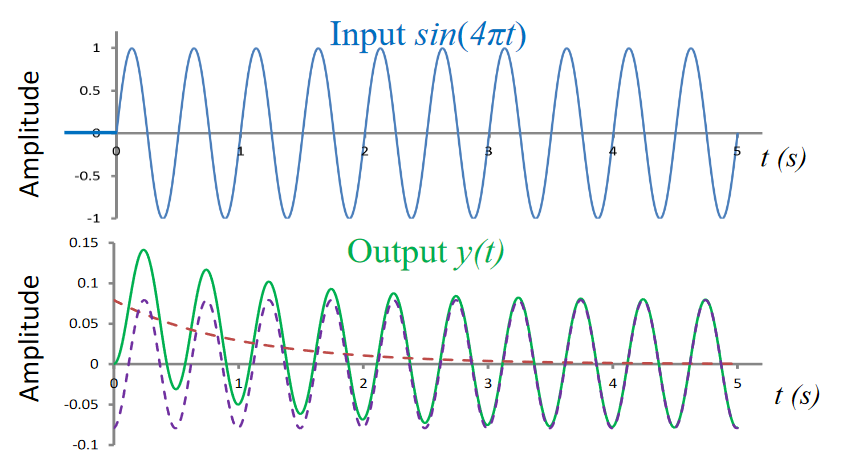
The steady state sinusoidal and transient exponential part of this response can be seen in the equation.
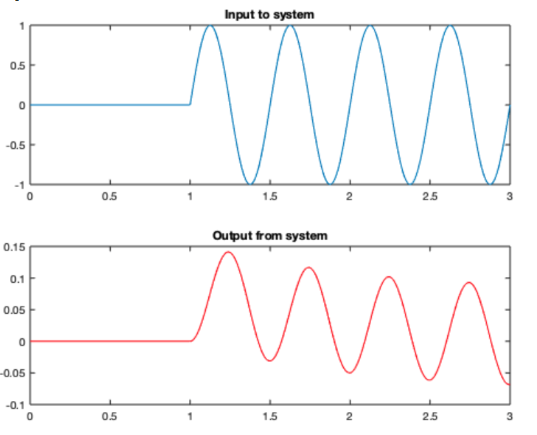
Matlab Example
The following code generates the following plot
system = tf(1,[1 1]);
t = 0:0.01:3; % time value vector
u = (t>=1).*sin(4 * pi * t) %input signal for t >= 1
y = lsim(sys,u,t); % simulate system with input u

figure;
subplot(2,1,1); plot(t,u); title("input");
subplot(2,1,2); plot(t,y,'r'); title("outputA");
Gain and Phase
Gain is the ratio of output to input amplitude, ie how much bigger or smaller the output is compared to input.
Phase difference is how much the output signal is delayed compared to the input signal. Both are functions of input frequency .
The frequency response can be obtained by substituting for in the transfer function. This gives a complex function as shown
Magnitude gives the amplitude of the response, and the argument of the complex number gives the phase shift . The substitution is used, is because in the Laplace domain, both signals and systems are represented by functions of .
- The -plane is the complex plane on which Laplace transforms are graphed.
- Generally,
- is the Neper frequency, the rate at which the function decays
- is the radial frequency, the rate at which the function oscillates
- Periodic sinusoidal inputs are non decaying, so , giving
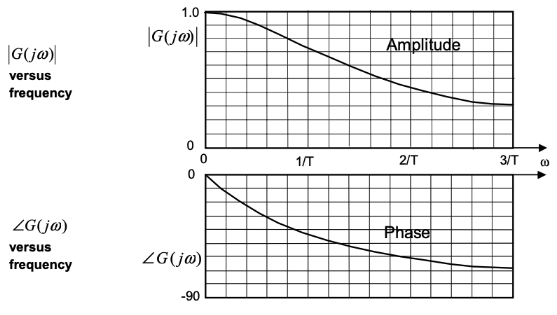
To find the frequency response parameters:
The graphs below show the frequency response in terms of for varying frequency :
Example
Given a transfer function , what is the magnitude and phase of frequency response?
Bode Plots
Bode plots show frequency and amplitude of frequency response on a log scale. Information is not spread linearly accross the frequency range, so it makes more sense to use a logarithmic scale. An important feature of bode plots is the corner frequency: the frequency at the point where the two asymptotes of the magnitude-frequency graph. This point is where .
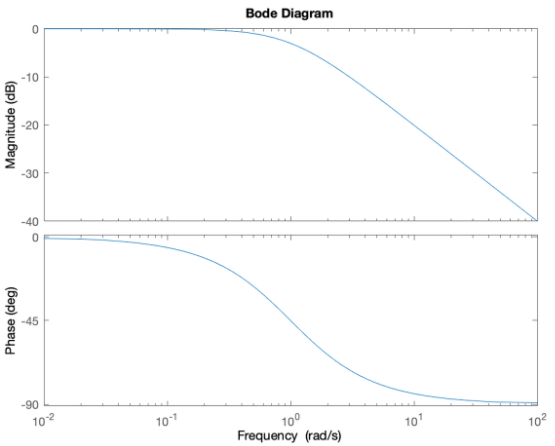
The plot above is for the function . The gain is measured in decibels for the magnitude of the response.